Every client’s monthly report, written in two minutes
Connect their Google Analytics and MyReportify writes what happened this month, why it matters and what to do next. In a PDF with your logo, in English or Spanish, ready to send.
A complete report, free and with no card. Not a demo or a 14-day trial: it does not expire.
Google verified our read-only Analytics permission
From GA4 to PDF in three steps
Set up once per client. After that, every month is one click.
- 1
Add a client
Their name, their email, their GA4 property ID and their website.
- 2
Connect Google Analytics
One Google button, read-only permission. Your Google account just needs access to their GA4. Once per client.
- 3
Generate, review, send
In one or two minutes you have last month’s report. Read it, adjust it if you want and send it.


Screens of the product · client names are made up
All of MyReportify at a glance
What it reads, how it writes the report, each client’s dashboard, everything included and the connections coming soon. With the real screens and the sample data. The on-screen text is in Spanish.
What doing it by hand costs you
Open GA4, pull the figures, compare them, write what happened and lay it out. Put in your own numbers: we do not know how long it takes you.
The sum only uses the figures you enter above.
By hand, every month
12h
€360 of your time
With MyReportify
€149
Business plan · €149/mo
Each report takes one or two minutes to generate, because it reads Google Analytics and the client’s website before writing. Reading it and sending it is still your job, as it should be.
The report, up close
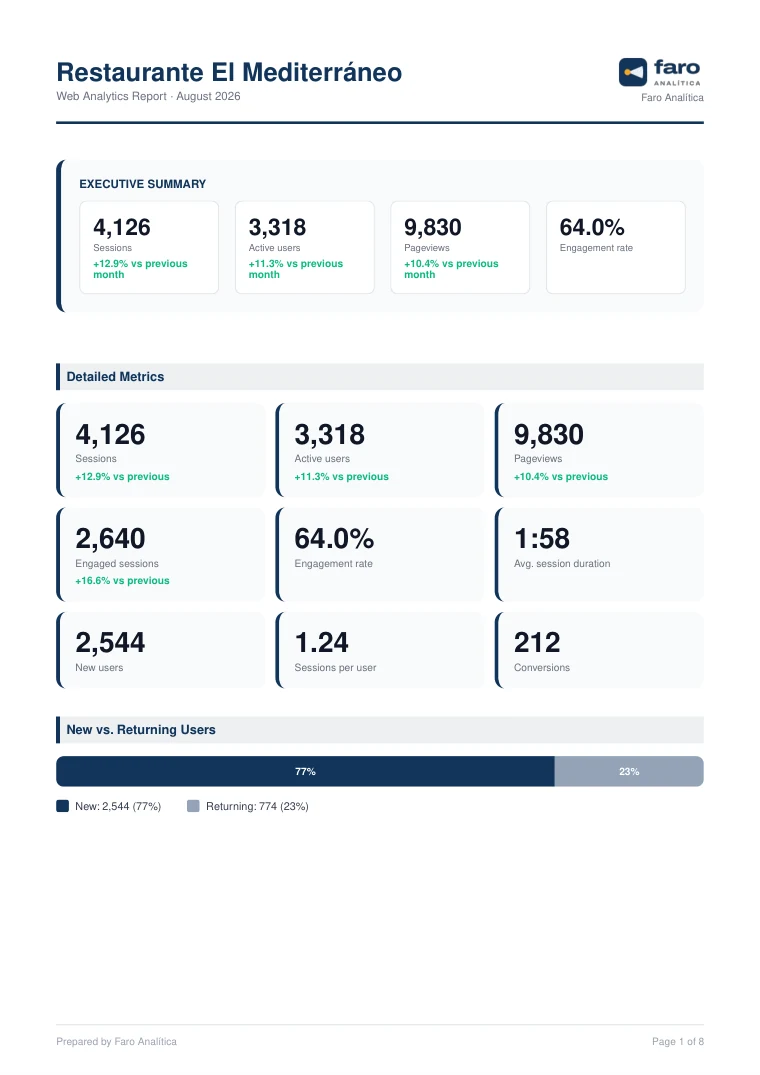
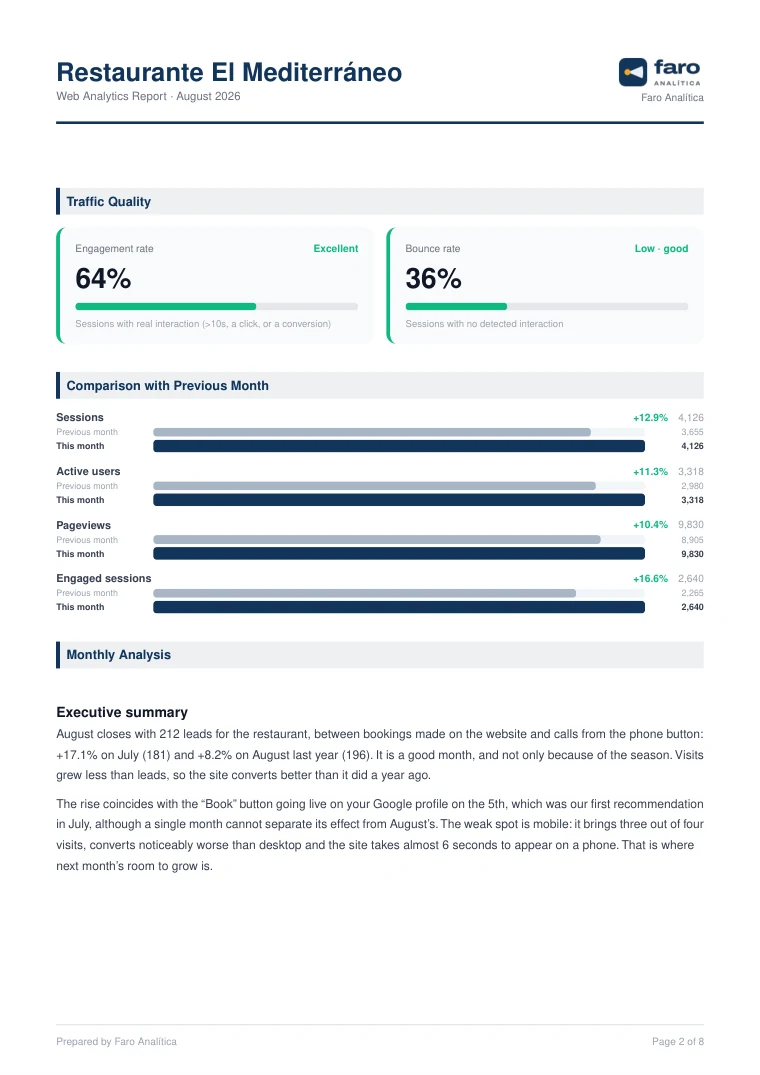
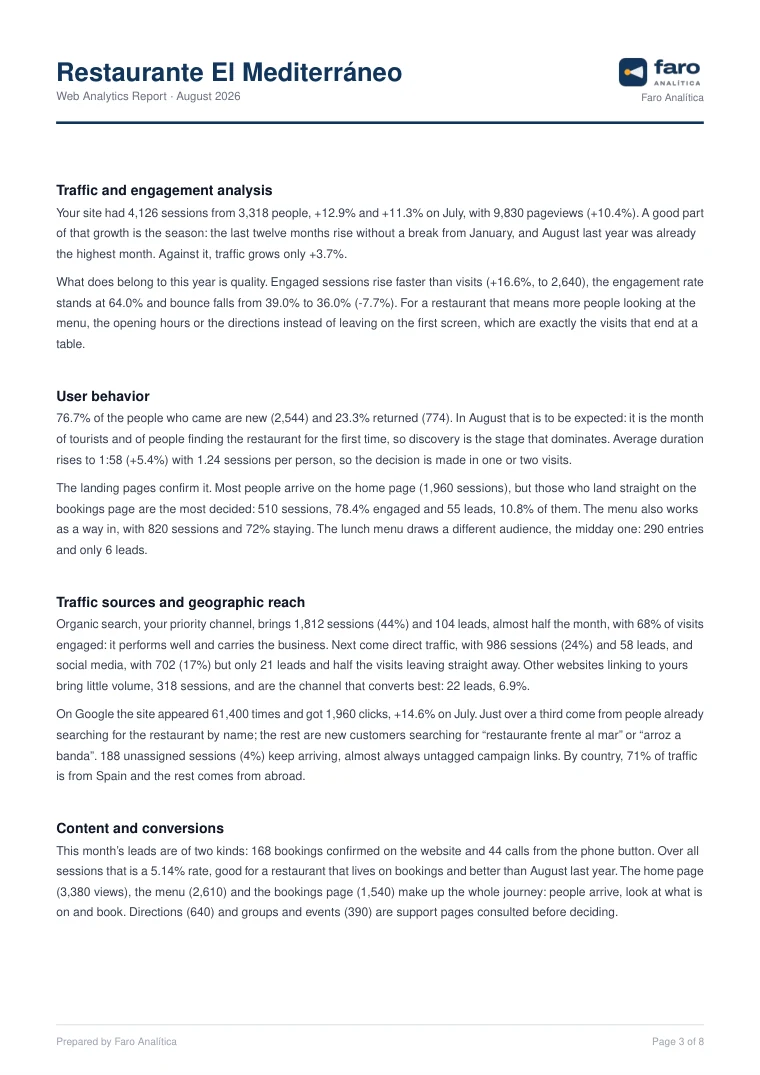
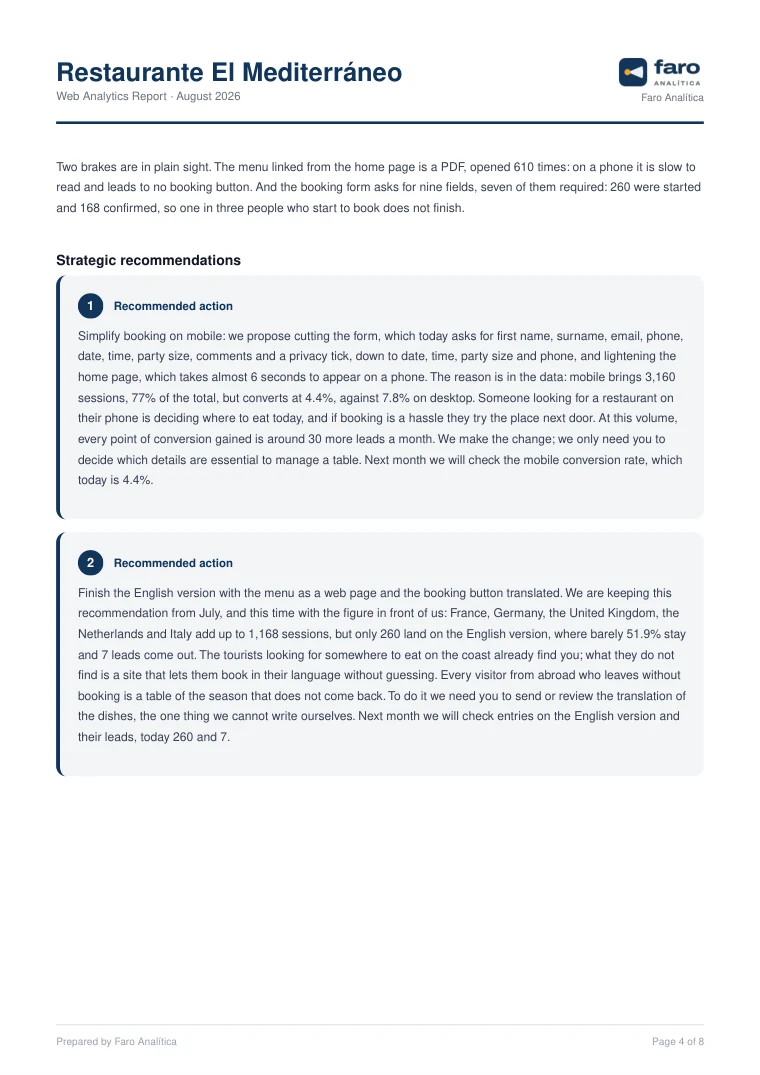
Five passages from the sample report, exactly as they come out. This is what your client reads.
“August closes with 212 leads for the restaurant, between bookings made on the website and calls from the phone button: +17.1% on July (181) and +8.2% on August last year (196).”
Compares with last month and with last year
So your client knows whether it was a genuinely good month or just the season.
“And the booking form asks for nine fields, seven of them required: 260 were started and 168 confirmed, so one in three people who start to book does not finish.”
Reads the website and explains the why with a fact
It does not guess: it has seen the form. And it crosses it with the Analytics data to say where the booking is lost.
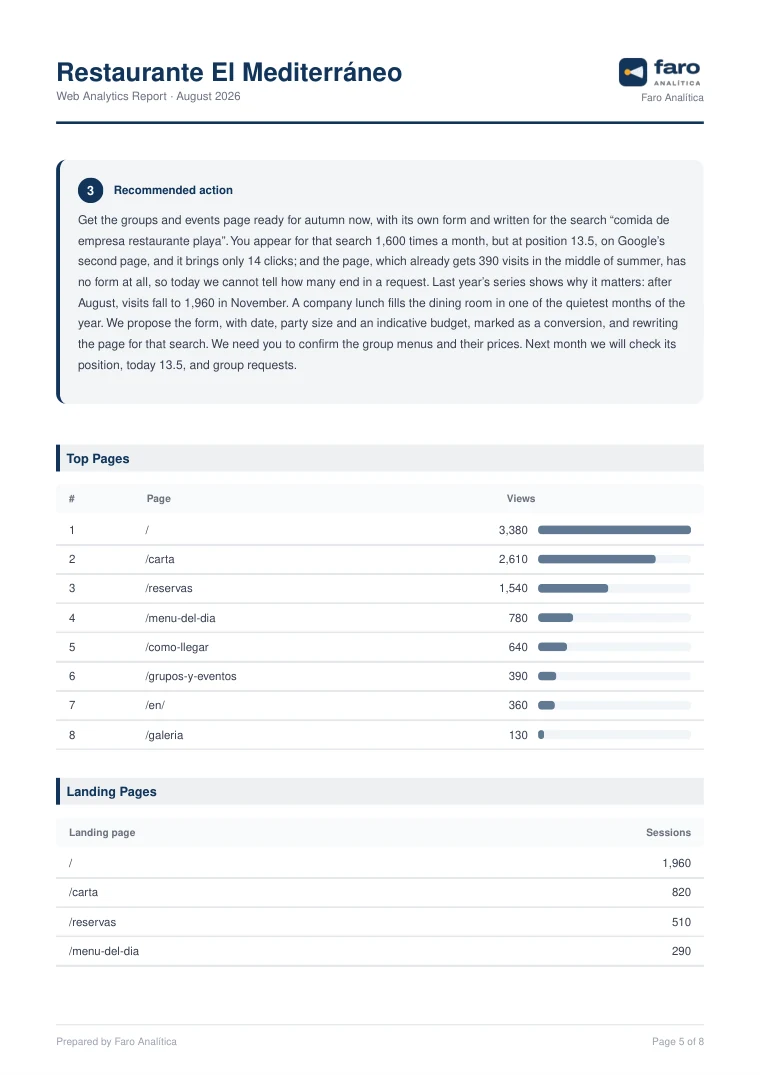
“You appear for that search 1,600 times a month, but at position 13.5, on Google’s second page, and it brings only 14 clicks”
Knows what people search for on Google
With Search Console it finds the searches where the site already shows but far from the top: the clearest room to win customers.
“The rise coincides with the “Book” button going live on your Google profile on the 5th, which was our first recommendation in July, although a single month cannot separate its effect from August’s.”
Remembers what it recommended, and takes no credit it cannot prove
It says “coincides with”, never “thanks to”. Your client trusts a report that does not oversell.
“Next month we will check the mobile conversion rate, which today is 4.4%.”
Every recommendation leaves the figure that will test it
Next month’s report starts from there, so you can see whether it worked.
Sample report · El Mediterráneo Restaurant · example agency and data
Where every sentence in the report comes from
A report is only useful if your client believes it. So it is not written from a template: every month it reads everything that client has connected, and every sentence has to rest on one of those sources.
The month’s report
- Executive summary
- Traffic and engagement
- Behaviour
- Traffic sources
- Content and conversions
- Recommendations
Google Analytics, this month and the twelve before
- What it reads
- Visits, users, pages, channels, devices and countries; conversions by channel, device and page; key events; and the thirteen-month series, which includes the same month last year.
- Why it matters
- With the series in front of it, it can tell a real drop from the dip August brings every year, and it says where the leads or sales come from, not just the visits.
Google searches
- What it reads
- With Search Console connected: which searches the site appears for, how often, how many click and at what position; the pages that get the most clicks from Google; and the searches where it already appears but far from the top.
- Why it matters
- Analytics says “1,800 visits came from Google”; this says what they were looking for. So an SEO recommendation is concrete: “you rank 7th for "restaurant by the sea", with 5,200 impressions and 96 clicks; reaching the top three multiplies them”.
The client’s website
- What it reads
- The home page and the pages most people land on: forms and how many fields they ask for, buttons, phone, WhatsApp, menus or catalogues in PDF, pages returning errors, whether they work on a phone, mobile speed measured with Google PageSpeed, and whether the Analytics tag installed is that client’s.
- Why it matters
- Recommendations start from what the site really has: “the booking form asks for 9 fields”, not “maybe simplify the form”. And if the Analytics tag is not theirs, it says so before drawing conclusions from numbers that do not belong to that site.
The store, email and the CRM
- What it reads
- If you connect them with their key: orders, sales, average order value and best-selling products from Shopify or WooCommerce; sends, opens and clicks from Mailchimp, Brevo or Klaviyo; contacts and deals from HubSpot. For the month and the previous one.
- Why it matters
- Analytics counts visits; the store counts what was sold. With real sales the report talks about money, and with email and the CRM it follows the customer after the visit, never mixing those figures with Analytics.
The client’s profile
- What it reads
- Their sector, main goal, what they sell, to whom, and the channel with the most investment.
- Why it matters
- The same figure means different things in different businesses: 70% of visits from phones is urgent for a restaurant and normal for a law firm. The report opens with what matters to the client, whether that is leads, sales or bookings.
What you tell it about the month
- What it reads
- An optional note when generating: “we changed the site on the 12th”, “the Meta campaign started”.
- Why it matters
- Google Analytics says what happened, never why. With the note, the report relates changes to the numbers, cautiously (“coincides with”, never “thanks to”), and never claims work you have not told it about.
What it recommended in earlier months
- What it reads
- The recommendations from that client’s last two reports.
- Why it matters
- It does not repeat the same advice every month, it picks up what is still pending, and it says, figure in hand, whether what was proposed worked.
Before you read it
- It is forbidden to invent figures: it only uses the ones from these sources.
- The text is checked to be complete, with its six sections and three recommendations, before the PDF is built.
- Every recommendation ends with the figure that will tell next month whether it worked.
- You review it and can change any paragraph before sending it.
The connections
Google Analytics 4 is the only one required. Everything else is connected per client, if they have it, and the report reads it all together.
Available today
- Google Analytics 4required
- Search Console
- Web
- Shopify
- WooCommerce
- Mailchimp
- Brevo
- Klaviyo
- HubSpot
- Google Sheets · CSV
Coming soon
- Google Business Profile
- Meta
- YouTube
- TikTok
- Google Ads
- TikTok Ads
- LinkedIn Ads
- Microsoft Advertising
The “coming soon” ones cannot be connected yet. In the app you can ask to be told when they arrive.
From the number to the decision
What changes when the report reads, besides Google Analytics, the client’s website and what people search for on Google.
It starts from what the site really is
A report with Analytics only
“Add a booking button”, even if the client already has one.
A MyReportify report (sample data)
“Your booking form asks for nine fields: cut it to four.” And what it cannot check it proposes as something to review, never as a fact.
It explains why it happens
A report with Analytics only
“Mobile converts at half the rate of desktop.”
A MyReportify report (sample data)
“…and the site takes almost 6 seconds to appear on a phone.” A concrete reason and a fix that is checked the following month.
It warns when the numbers are not reliable
A report with Analytics only
It seriously analyses data that does not belong to that site.
A MyReportify report (sample data)
If the Analytics tag installed is not the client’s, if a page with traffic returns an error or Google cannot show it, it says so before drawing conclusions.
It says what people search for on Google
A report with Analytics only
“1,800 visits came from Google.”
A MyReportify report (sample data)
“They searched for "restaurant by the sea"; you rank 7th, with 5,200 impressions and 96 clicks.” And it separates people who already know the business from new customers finding it.
It finds where the room to grow is
A report with Analytics only
Generic advice: “work on your SEO”.
A MyReportify report (sample data)
The searches where it already appears but far from the top, with their position and figures, in a dedicated PDF section: “Google Search”.
It can be checked before it is sent
A report with Analytics only
You have to trust whatever the report says.
A MyReportify report (sample data)
“Check connections” and each report’s page show exactly what was read, so you can compare it with Google before sending it to the client.
What makes it the report you would sign yourself
Not a metrics summary. It is the report you would write yourself if you had a free afternoon per client every month.
A trend, not a snapshot
It reads the last twelve months and the same month last year. So it can tell a real drop from the dip August brings every year, and does not alarm your client over one bad month.
It remembers last month
Before writing, it rereads the recommendations from that client’s two previous reports. It does not repeat the same advice every month, and it picks up the ones still pending.
It knows what you did
When you generate, you can leave a note: “we changed the site on the 12th”, “the Meta campaign started”. The report takes it into account, and never claims work you have not told it about.
You review it before sending
Correct any paragraph before it goes out. The PDF is rebuilt with your text in seconds and does not use up a report from your plan.
With your brand
Your logo in the header of every page, your colour on the headings and charts, and your name in the footer. The logo fits itself to its shape, wide, square or tall.
Sent and tracked
Email it to the client from the app, in the report’s language, with a copy to you and replies to your inbox. The dashboard shows what was sent, to whom and when.
A dashboard for your client
A link with their live figures, channel and device charts, a country map, their Google searches and the latest report with its PDF, in your logo and colour. Send it or embed it in your website, and you choose what they see. Your notes and campaigns never show.
Their data too, not just Google’s
Shop sales, calls, quotes: connect a Google Sheet or upload a CSV. The report takes it into account, quoting it as the client’s data without mixing it with Analytics, and it appears in the PDF and their dashboard.
A goal every month
Give each client their monthly goals: 200 bookings, 5,000 visits, 800 clicks from Google. The report opens by saying whether they were reached, with the figure and percentage computed for it, and aims the recommendations at closing any gap. Progress shows in the PDF and their dashboard.
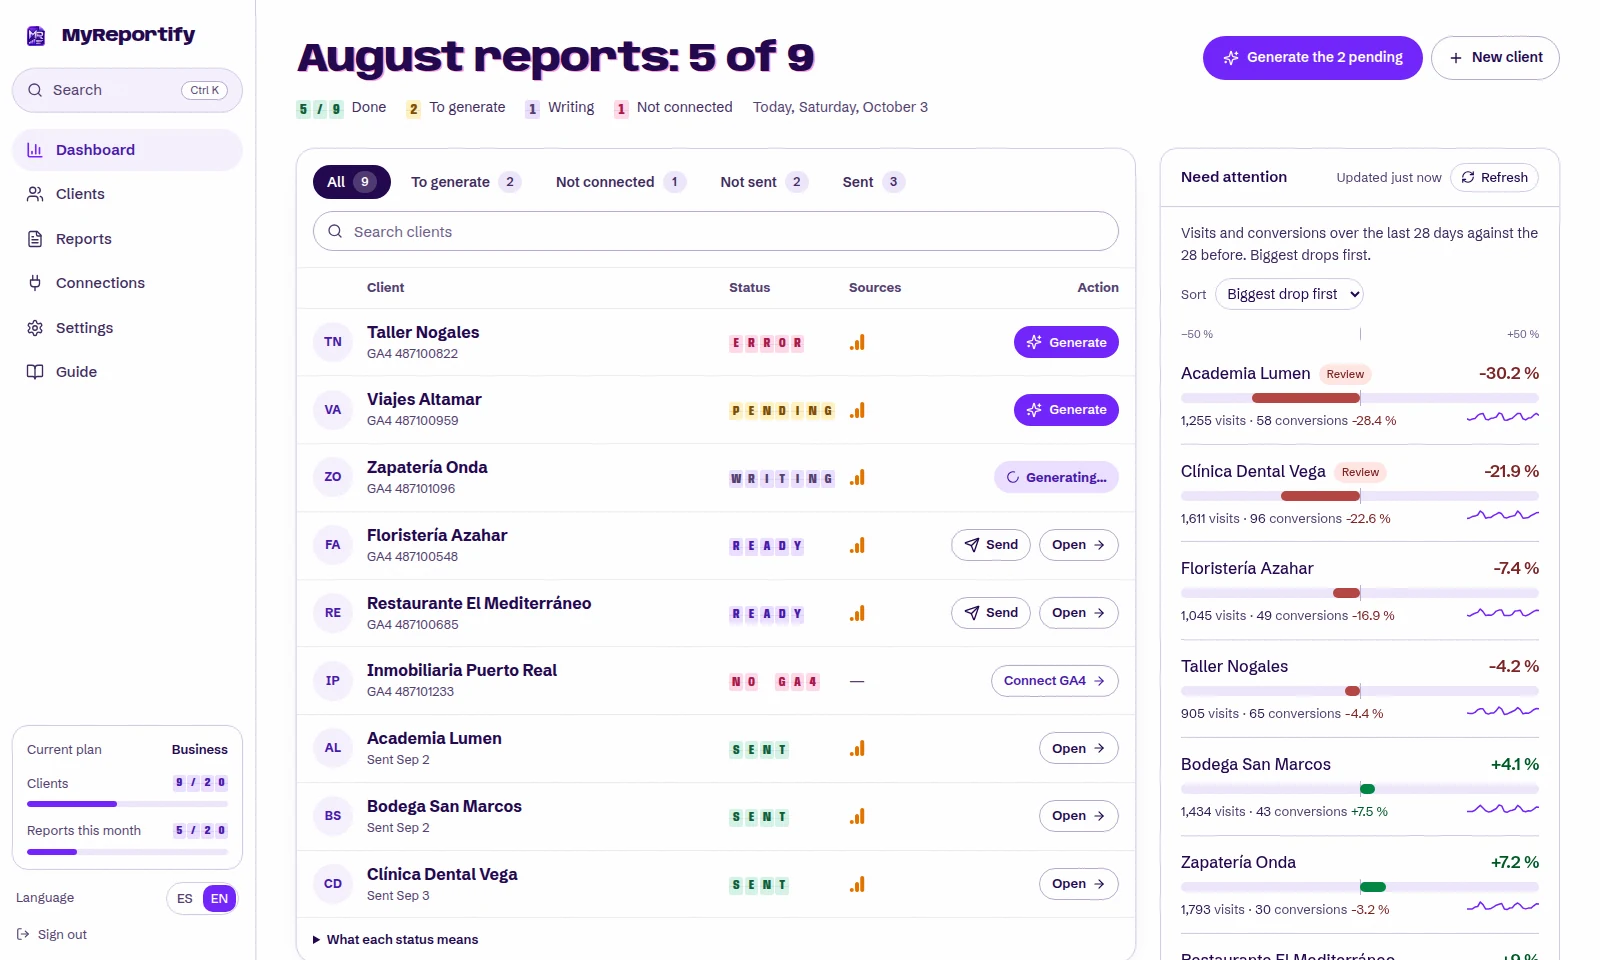
The month as a departures board: how many reports are done and, on the board, every client with its status in split-flap letters (pending, writing, ready, sent, no GA4) and the one action it needs: generate, send or open. Filter by status, search by name, and generating never takes you off the screen.
View full sizeScreens of the product · client names are made up
Why not Looker Studio or ChatGPT?
They are good tools, and you probably use one already. The difference is what is left to do afterwards.
Looker Studio
What it gives you
Charts and tables that update themselves. It is free.
What is left to do
Someone has to look at them every month and write to the client about what happened and what to do. A dashboard explains nothing.
ChatGPT or another AI
What it gives you
A piece of text, if you paste the data in.
What is left to do
Export from GA4 every month, paste it, check it has not made figures up, format it and turn it into a PDF. And it does not remember what it recommended last month.
MyReportify
What it gives you
The whole report: it reads GA4 and the client’s website, compares with last month and last year, remembers its recommendations and delivers a PDF with your logo.
What is left to do
Read it, adjust what you want and send it.
Your data and your clients’
- Google verified our read-only Analytics permission
- Read-only: it cannot change anything in GA4
- Data encrypted in transit and at rest
- Payments through Stripe: we never see your card
Clear pricing, no surprises
Try it for free by generating your first real report. No card. Cancel anytime.
Start free
1 client · 1 report · no card
Create the account, connect a real client of yours and generate last month’s report from their actual GA4 data. It is not a demo or a 14-day trial: it is a complete report and it does not expire, though it always covers the last closed month. From the second report, or the second client, you need a paid plan. If you do not have a client at hand yet, the app includes an example client you can explore without connecting anything.
Pro
For freelancers and independent consultants
€59/mo
Up to 5 clients
€11.80 per client when the plan is full
- Up to 5 active clients
- Up to 5 reports per month
- Full AI narrative in Spanish or English
- PDF with your logo, colour and name
- 12-month trend and comparison with last year
- Reads the client’s website, with mobile speed
- Google searches through Search Console
- Full metrics: sessions, engagement, pages, sources, devices, countries and conversions
- Edit the text before sending it
- Send it to the client from the app, with tracking
- Branded live dashboard for each client
- Monthly goals and own data (Google Sheets or CSV)
Business
RecommendedFor agencies and teams with more volume
€149/mo
Up to 20 clients
€7.45 per client when the plan is full
- Up to 20 active clients
- Up to 20 reports per month
- Full AI narrative in Spanish or English
- PDF with your logo, colour and name
- 12-month trend and comparison with last year
- Reads the client’s website, with mobile speed
- Google searches through Search Console
- Full metrics: sessions, engagement, pages, sources, devices, countries and conversions
- Edit the text before sending it
- Send it to the client from the app, with tracking
- Branded live dashboard for each client
- Monthly goals and own data (Google Sheets or CSV)
- Email support
Unlimited
For agencies that would rather not count clients
€299/mo
Unlimited clients
No cap: every client you add makes the rest cheaper
- Unlimited active clients
- Unlimited reports every month
- Full AI narrative in Spanish or English
- PDF with your logo, colour and name
- 12-month trend and comparison with last year
- Reads the client’s website, with mobile speed
- Google searches through Search Console
- Full metrics: sessions, engagement, pages, sources, devices, countries and conversions
- Edit the text before sending it
- Send it to the client from the app, with tracking
- Branded live dashboard for each client
- Monthly goals and own data (Google Sheets or CSV)
- Email support
Every plan starts the same way: create the account for free, try the report with a real client and choose a plan when you need one. No lock-in: cancel from your account and keep access until the end of the paid period.
Have a question? Contact us
Frequently asked questions
What if the AI gets it wrong?
It only works with that month’s GA4 figures and is forbidden from inventing data or attributing causes it does not know. Before the PDF is built we check the text is complete, with its six sections and three recommendations; if it is not, it is asked to redo it before going on. And you read it before sending: you can change any paragraph and the PDF is rebuilt without using up a report.
What do I need from my client to connect their GA4?
Your Google account needs access to their Google Analytics 4 property (viewer permission is enough) and the ID of that property. You connect once with the Google button, and from then on every month is one click. It does not work with Universal Analytics, the old version.
Which month does each report cover?
Always the previous, closed month, the only one whose GA4 data is complete. If you add a client today, their first report is last month’s, and the analysis takes the previous twelve months into account. Past months cannot be generated: if you let a month go by, that report can no longer be made.
Is my clients’ data safe?
We only ask for read permission, so MyReportify cannot change anything in your client’s Analytics account. Access credentials are stored in an encrypted database. To write the report, that month’s metrics and what was read from the client’s public website are sent to Anthropic, the AI engine that writes the text. Beyond that they are not shared with anyone, not sold and not used for advertising. It is all set out in the privacy policy.
Can I cancel whenever I want?
Yes, you can cancel from your account at any time. Access continues until the end of the already-paid period. No commitments or penalties.
Will my client see it was made with MyReportify?
Not in the PDF: with your agency name set in Settings, it carries your logo, your name and your colour, and mentions neither MyReportify nor AI. If you send it from the app, the email comes from our address with our header, but it presents the report as yours, your client’s replies reach you and you get a copy. The client dashboard, if you create one, carries a small “Made with MyReportify” in its footer. If you would rather we did not appear anywhere, download the PDF and send it from your own email.
What does it look at on my client’s website?
If you add their website to the profile, every time you generate a report it reads their home page and the pages most people land on according to Google Analytics: forms and how many fields they ask for, buttons, phone and WhatsApp, PDFs, pages returning errors and whether they work on a phone. Mobile speed is measured with Google PageSpeed, and it checks that the Analytics tag installed is that client’s. Only public pages are read, as any visitor would, and the report page shows exactly what was read.
What does connecting Search Console add?
Google Analytics says how many visits come from Google, but not what they searched for. Search Console does: the searches the site appears for, how often, how many click and at what position. The report adds a section with those figures and uses the searches where the site already appears but far from the top for concrete SEO recommendations. It is optional, read-only and connected once per client from their profile.
Can I see my clients’ figures during the month, without waiting for the report?
Yes. On each client’s page, “Trends” reads Google Analytics and Search Console live: any period, compared with the previous one or last year, filtered by channel or device, with conversions by type, campaigns, countries and searches. The dashboard shows all your clients over the last 28 days. It does not use up reports.
Will you tell me if something happens to a client?
Yes, by email. Every morning we check your clients’ Google Analytics and write to you if one drops 30% or more in a week, stops recording conversions or seems to have lost tracking. One email the day it appears, not every day it lasts. You can turn it off in Settings.
How do I know the report’s data is right?
Each client’s page has a “Check connections” button that reads right then what the report will read and shows last month’s figures from Analytics, the site’s tag, the website itself and Search Console. You compare them with what you see in Google before generating. If something is off, it says what and how to fix it. It does not use up a report.
How is it different from Looker Studio?
Looker Studio lets you build a dashboard of charts, and it is free. But a dashboard explains nothing: someone has to look at it and write to the client about what happened and what to do. MyReportify does that part: it reads the data, compares it with last month and last year, and writes the report.
Does the report carry my logo?
Yes, if you upload it in Settings. It appears in the header of every page with your company name underneath, and it adjusts itself to its shape — wide, square or tall — so it never throws the layout off. PNG or JPG up to 2 MB; best with a transparent background. You also choose the colour, used on the headings, the charts and the borders. Without a logo, the report carries your name in the header.
What language are the reports generated in?
You choose English or Spanish every time you generate a report. The text is written directly in that language, not translated, and the email to the client goes out in that language too.
What happens after the free report?
You decide whether to carry on. If you subscribe, you keep generating reports every month; if not, your clients and your report stay in your account. Nothing is deleted.
Try it with a real client
Generate the first report from one of your clients’ real data and judge for yourself whether you would send it. No card, and it does not expire.
There are two people behind this, Adrián and Alberto, from Spain. We are just starting, and what you tell us changes the product. Who we are